Base rates
A base rate is the prior prevalence that weights a hypothesis’s contribution to observed evidence.
On this page 8 sections
01A base rate is how common an event is before applying a filter or looking at a signal#
A base rate is how common an event is before applying a filter or looking at a signal. Even a fairly selective signal can return many false alarms if the event is rare. The filter acts on both the event group and the much larger non-event group.
A base rate is the prevalence of a hypothesis before the evidence. Alert reliability depends on how many alerts come from that group and how many come from its alternative.
Of 1,000 records, 20 have H. Alert rates 0.9 in H and 0.1 outside H produce 18 H alerts and 98 other alerts.
In a hypothetical set of 1000 messages, 10 are unwanted. A filter catches 9 of those and flags 99 of the 990 wanted messages. Of 108 flags, only 9 are truly unwanted, giving . Its 90% catch rate describes the unwanted group, not the reliability of a flag.
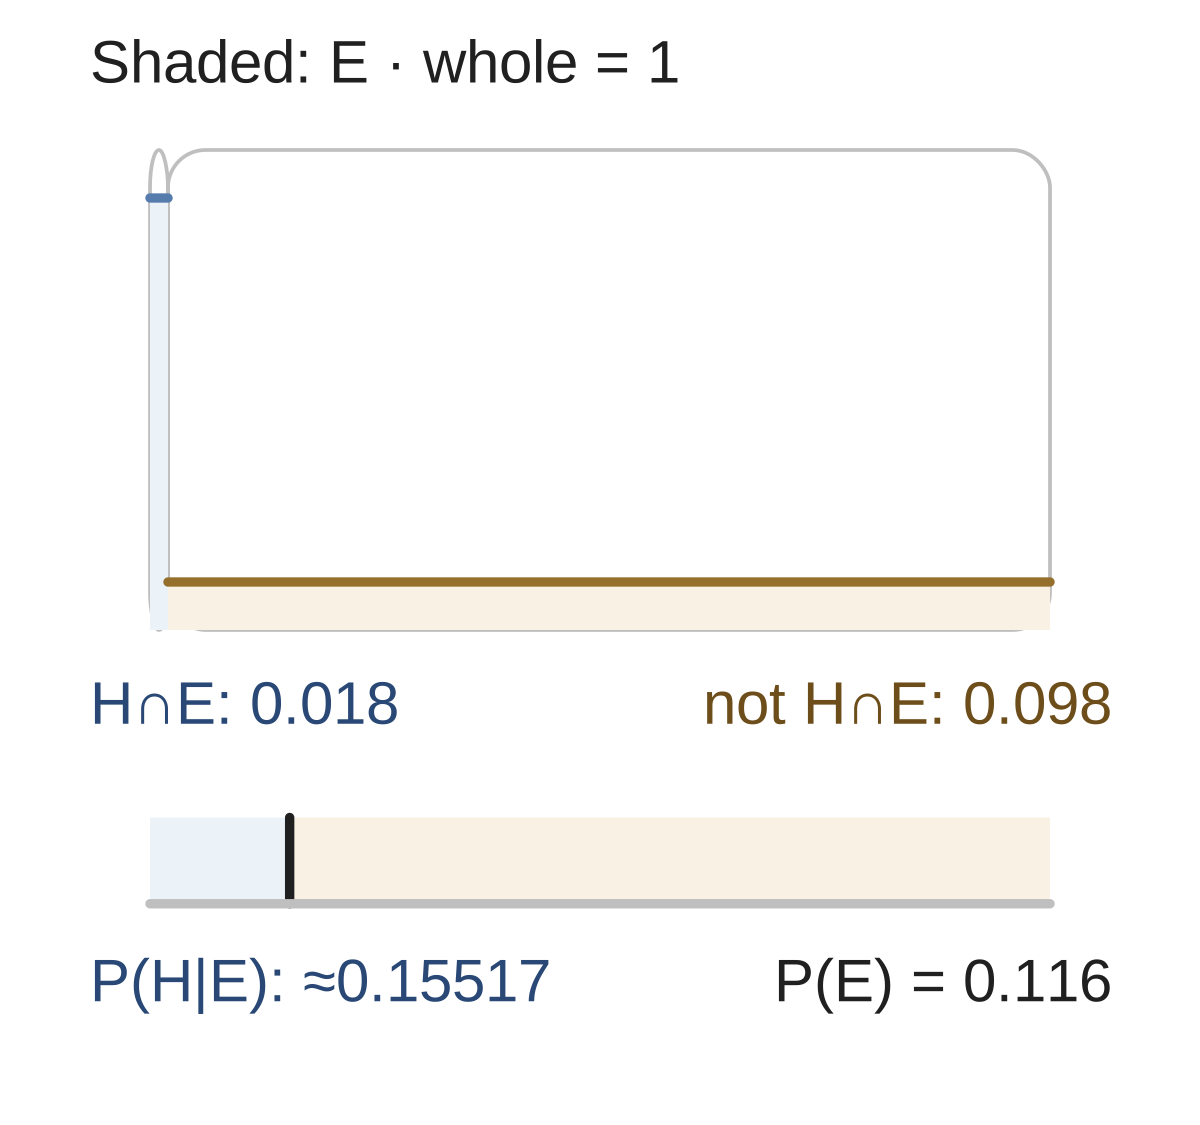
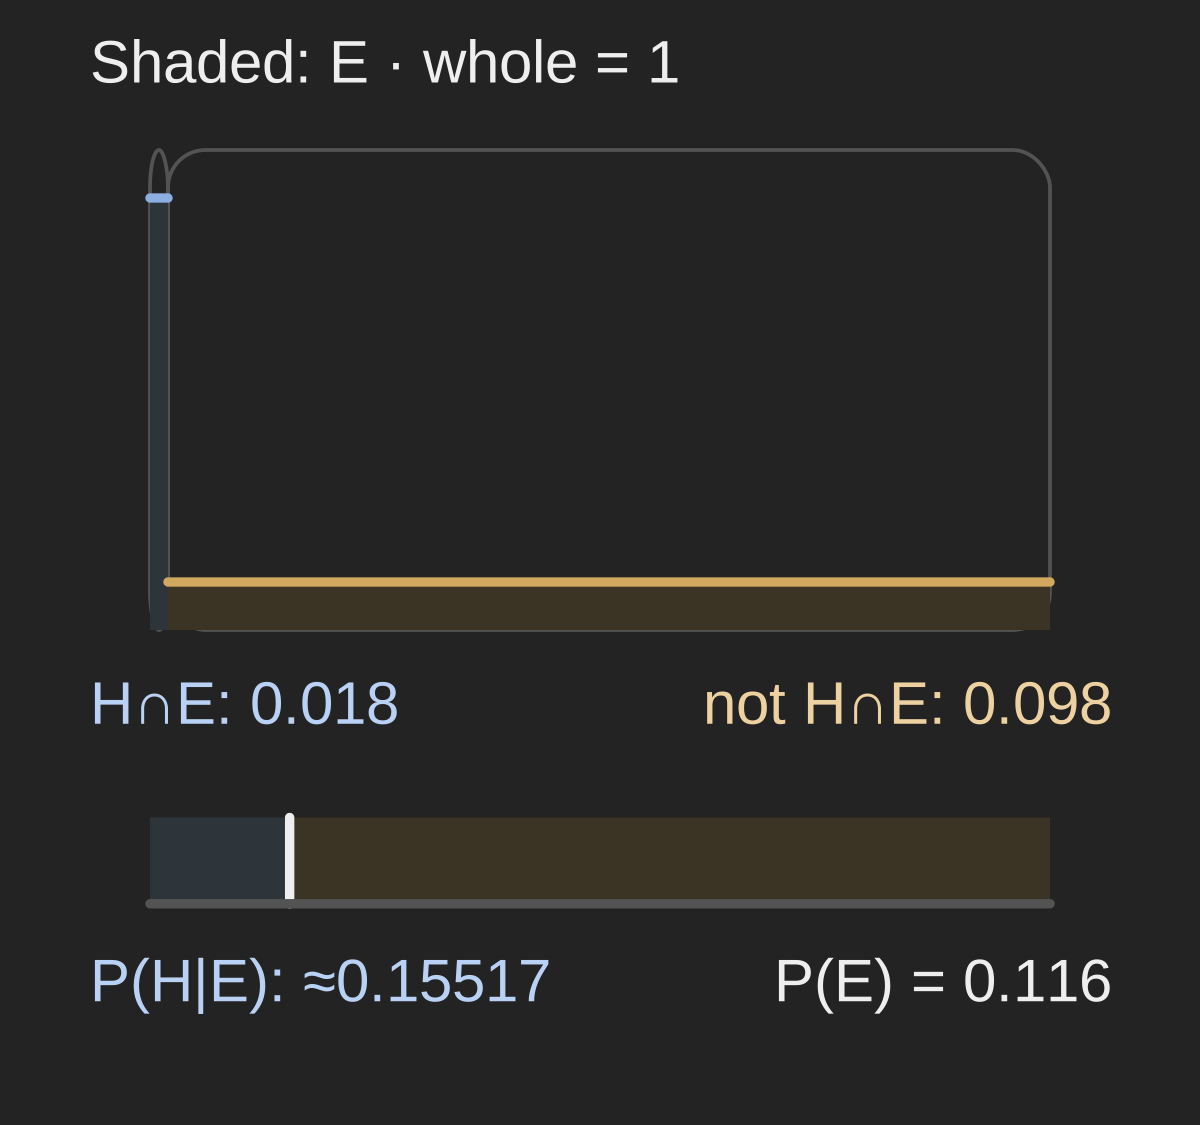
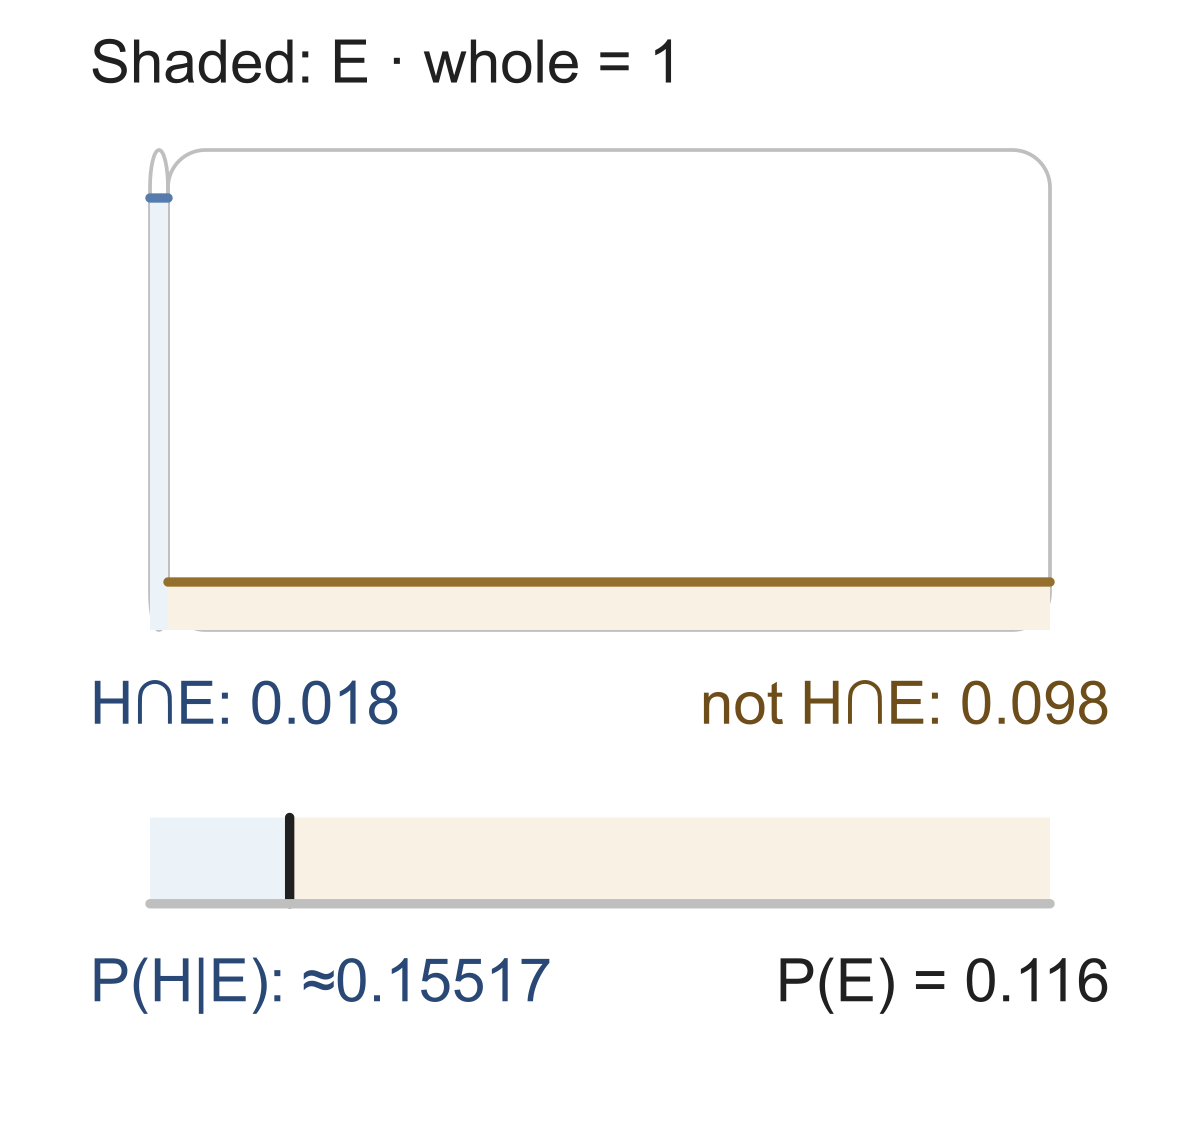
Among all 116 alerts, only 18 have H: posterior 18 / 116 ≈ 0.155. The large alternative group supplies more alerts even with a much lower alert rate.
Groups: 10 H, 90 other. Alert rates: 0.8 in H, 0.2 in other. Alert counts?
Show answer and explanation
8 of 26 alerts have H.
02Hold both alert rates fixed and positive#
Hold both alert rates fixed and positive. Increasing H’s prevalence adds H alerts while reducing other alerts in the same-sized population. H then occupies a larger share of the alert group.
H prevalence: X 0.1, Y 0.3. Both use alert rates 0.6 in H and 0.2 in other. Higher P(H | alert)?
Show answer and explanation
Y raises H’s share.
03Rarity alone does not force a low posterior#
Rarity alone does not force a low posterior. If other records never alert and some H records do, every alert has H, even when H is rare.
Groups: 40 H, 160 other. Alert rates: 0.75 in H, 0.25 in other. “P(H | alert)=0.75.” Repair with alert counts.
Show answer and explanation
H has 30 of 70 alerts.
04A closer look#
When evaluating an alerting or classification system, report the population and base rate along with conditional performance. A signal used in a different population can have a different fraction of correct flags even if its within-class detection rates stay the same.
Compare prior-weighted alerts from the hypothesis and its alternative. A within-group alert rate alone does not describe the group of all alerts.
- Explain a posterior using weighted alert contributions.
Sources & further reading
- [1]Pishro-Nik, Introduction to Probability: 1.4.3 Bayes Rule, false-positive example ↗Pishro-Nik, Introduction to Probability · Book