Covariance
Covariance is the expectation of the product of two variables’ centered deviations.
On this page 9 sections
01Understand the idea#
Covariance measures whether two variables tend to deviate from their means in the same direction. Pair deviations from the same observation, multiply them, and average with the distribution’s weights. Positive products represent same-direction deviations; negative products represent opposite-direction deviations.
Covariance averages how two variables deviate from their means together. A convenient calculation uses three expectations from the joint distribution.
![Joint rows X=0,1 and columns Y=0,1 are (0.1,0.2) and (0.3,0.4). From these paired masses E[X]=0.7, E[Y]=0.6 and E[XY]=0.4. Covariance subtracts 0.7 times 0.6 from 0.4 to give −0.02.](/visuals/p-covariance/grid-1g2gjh9.svg)
![Joint rows X=0,1 and columns Y=0,1 are (0.1,0.2) and (0.3,0.4). From these paired masses E[X]=0.7, E[Y]=0.6 and E[XY]=0.4. Covariance subtracts 0.7 times 0.6 from 0.4 to give −0.02.](/visuals/p-covariance/grid-1g2gjh9-dark.svg)
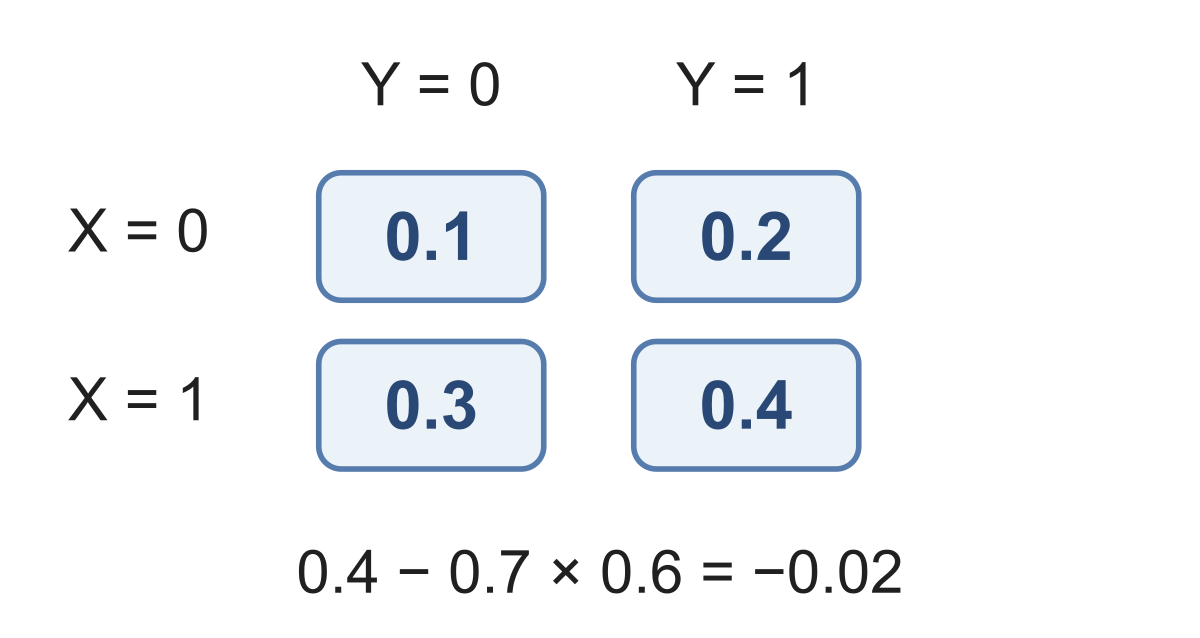
For binary with joint rows , the means are 0.7 and 0.6. Only contributes to .
Suppose equally likely outcomes are and . Their means are 2 and 4. Deviation products are and , so covariance is 2. Pairing an from one outcome with a from another would describe a different joint distribution.
Rows ; columns . Joint rows: . Find .
Show answer and explanation
.
02The binary table gives #
The binary table gives . Returning 0.4 would omit centering. Positive covariance favors same-sign centered deviations; negative covariance favors opposite signs.
X rows, Y cols; each 0,1. Joint rows: . A learner uses . Give covariance.
Show answer and explanation
.
03Use the actual support values, including their signs#
Use the actual support values, including their signs. Compute both means and the product mean before subtracting; joint cells need not have equal weights.
Zero covariance does not prove independence. Let be uniform on and . Then , so covariance is zero.
Yet , while . This cell fails the independence test.
X,Y are feature values. Rows ; columns . Joint rows: . Find .
Show answer and explanation
.
04A closer look#
Feature covariance helps describe which measurements vary together and supplies entries of the covariance matrix used by PCA. Its units are the product of the two variables’ units. Zero covariance rules out linear co-movement as measured here, but does not generally imply independence.
Subtract the product of means from the mean of products.
- Compute covariance from a joint distribution.
Further questions
Does covariance zero prove independence?
Sources & further reading
- [1]