Bootstrap intervals
A percentile bootstrap interval takes the two tail quantiles corresponding to a central confidence level from bootstrap statistic replicates; its coverage is an approximation.
On this page 8 sections
01Understand the idea#
A percentile bootstrap interval uses the middle part of a collection of bootstrap statistic values. It summarizes uncertainty in the statistic rather than selecting the middle observations from the original dataset. First resample, then compute one statistic per resample, then find the stated percentiles.
A percentile bootstrap interval uses two quantiles of bootstrap statistic outputs to approximate a confidence interval. For a central 90% interval, leave 5% in each tail and read the 5th and 95th percentiles.
For central fraction , tail fractions are and . Sort the supplied replicates, retaining repeats. Multiply a tail fraction by , and round upward to a rank.
If bootstrap means are , sort these five values before using a percentile rule. Under a rule that selects the second and fourth ordered values, the interval is . A different interpolation rule could give different endpoints, so follow the exact quantile convention supplied.
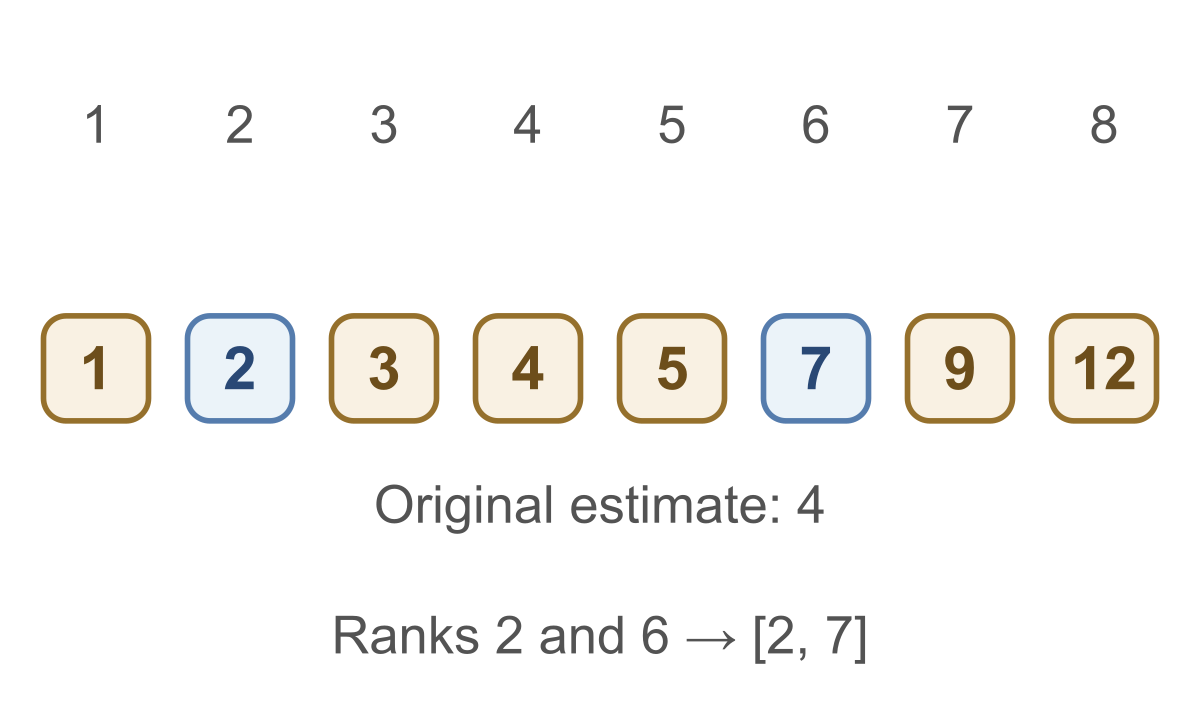
For these eight outputs, central 50% uses . Ranks are , so the interval is .
![Sorted bootstrap outputs are 1,2,3,4,5,7,9,12. Each displayed rank is equally spaced; this is an ordered list, not a metric number axis. Central 50 percent leaves 25 percent in each tail. With B=8 and rank rounded upward, ranks 2 and 6 select 2 and 7. The interval [2,7] is not centered on the original estimate 4.](/visuals/s-bootstrap-interval/number-line-11xx5t5.svg)
![Sorted bootstrap outputs are 1,2,3,4,5,7,9,12. Each displayed rank is equally spaced; this is an ordered list, not a metric number axis. Central 50 percent leaves 25 percent in each tail. With B=8 and rank rounded upward, ranks 2 and 6 select 2 and 7. The interval [2,7] is not centered on the original estimate 4.](/visuals/s-bootstrap-interval/number-line-11xx5t5-dark.svg)
Replicates: 0, 2, 4, 6, 8, 12. Central 50%. Rule: sort; percentile p uses rank pB rounded up. Interval?
Show answer and explanation
Ranks 2, 5 give [2, 8].
02The interval need not center on the original estimate#
The interval need not center on the original estimate. In the example, estimate does not force equal distances to and . These tiny lists illustrate endpoint mechanics; they do not establish reliable coverage.
IID bootstrap percentiles: 10%=4; 50%=7; 90%=12. Central 80% interval / coverage?
Show answer and explanation
Use 10% and 90%.
03More resamples make the empirical percentiles more stable#
More resamples make the empirical percentiles more stable. They do not add new observations. A small original sample or an extreme statistic, such as a maximum, can give poor coverage even with many resamples.
Maximum of 4 IID observations. “10000 resamples fix tail coverage.” Repair.
Show answer and explanation
No unseen tail data.
04A closer look#
A percentile interval is an approximation and can perform poorly for small samples, strong bias, or unsuitable statistics. Many computational replicates reduce simulation noise in the endpoints; they do not repair an unrepresentative original sample.
Use the stated percentile convention on the bootstrap outputs, read both tail endpoints, and retain the limitations of the original sample and statistic.
- Read both percentile endpoints and their limits.
Sources & further reading
- [1]Adhikari, DeNero and Wagner, Computational and Inferential Thinking, 13.3 Confidence Intervals ↗Adhikari, DeNero and Wagner · Article
- [2]R Core documentation, Sample Quantiles ↗R Core · Article