Continuous likelihoods
A continuous likelihood evaluates the joint density at fixed observed points as a function of the candidate parameter.
On this page 9 sections
01Understand the idea#
For a continuous model, an exact observed point has probability zero, yet its density can compare candidate parameter settings. A continuous likelihood multiplies the candidate densities at the observed values. It is a density-based score for the fixed sample, not the probability of those exact points.
For the same two independent observations, candidate A supplies densities 2 and 3; B supplies 1 and 4. Their likelihoods are 6 and 4. A has the larger density likelihood.
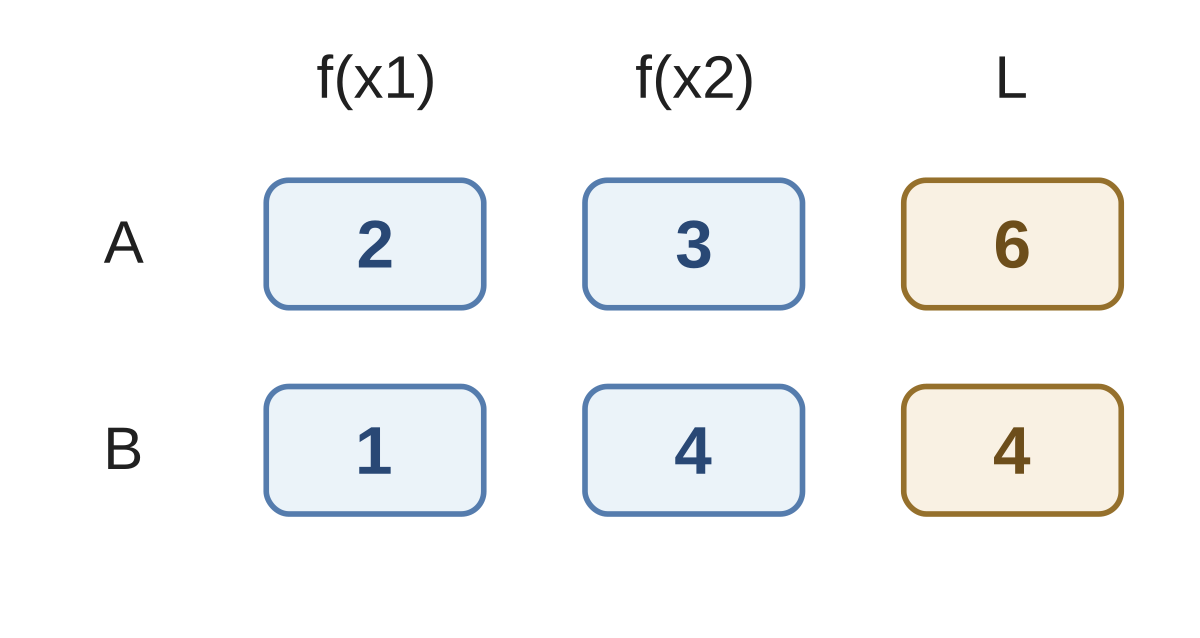
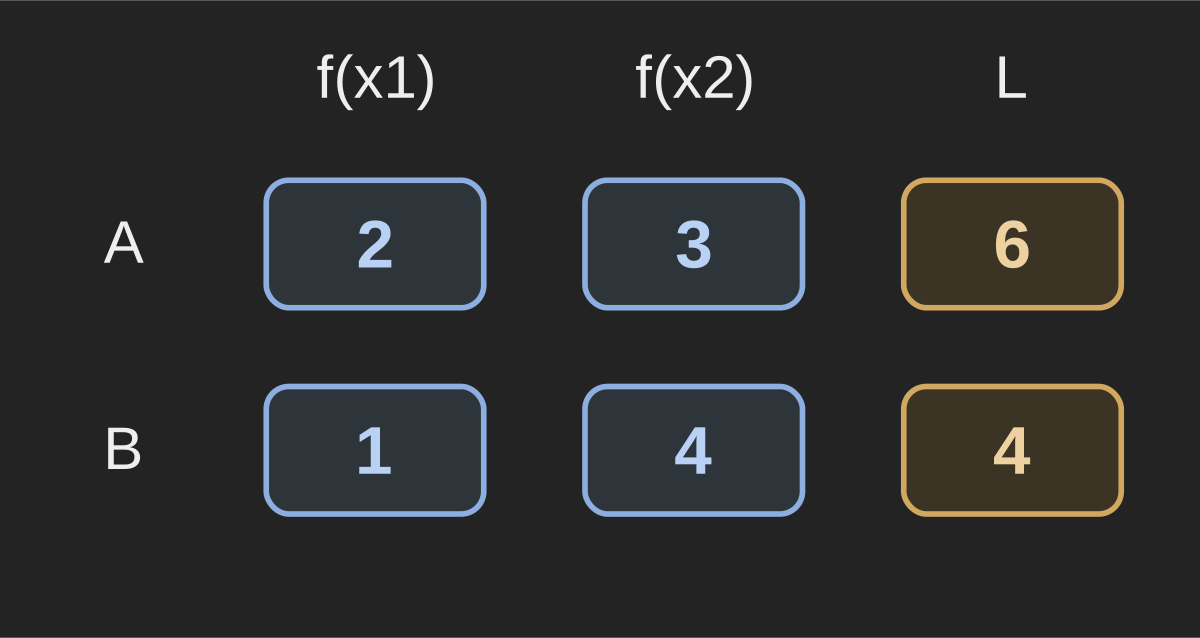
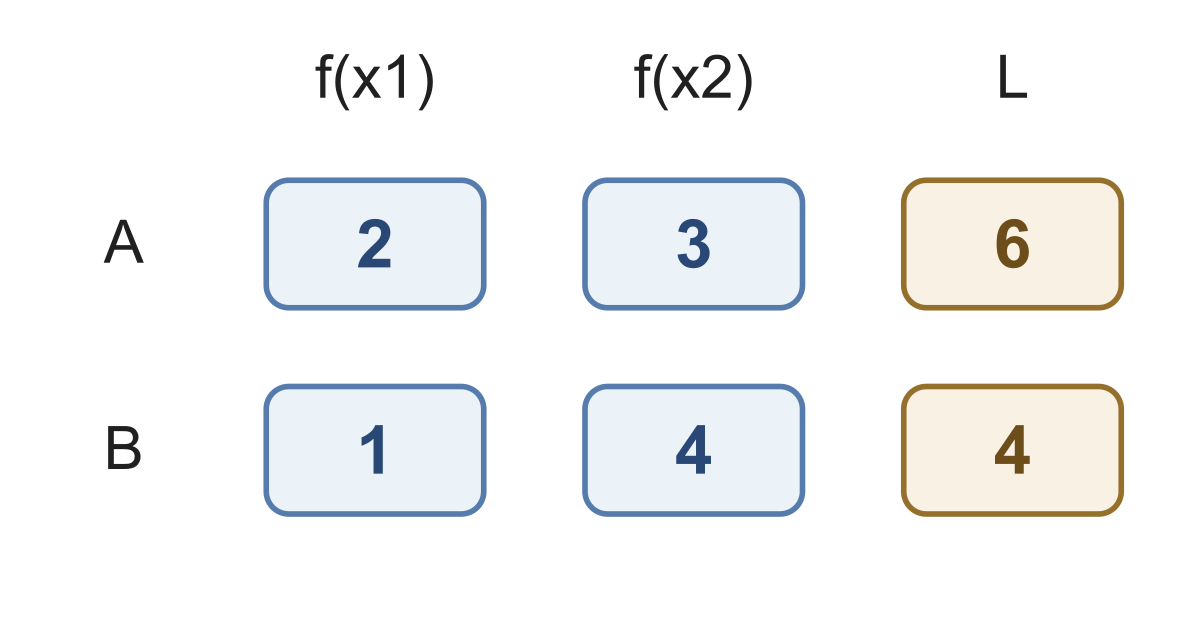
Keep the observed points fixed and evaluate each candidate density at them. Independence lets those density values multiply.
If a candidate gives densities 0.5 and 2 at two independent observations, their likelihood product is 1. Another candidate giving 0.8 and 0.8 has product 0.64. A density or product above 1 is allowed; total probability is controlled by integrating density over a region.
Fixed independent sample. Densities in data order: A ; B . Give .
Show answer and explanation
Products: .
02An exact point has probability 0 under a continuous density#
An exact point has probability 0 under a continuous density. That does not set its density value to 0. Density likelihoods can exceed 1 and need not sum to 1 across candidates.
Independent data. Densities: A ; B . Claim: zero point probabilities make likelihoods zero. Repair.
Show answer and explanation
Products: .
03Support matters#
Support matters. With iid data and uniform density on , candidate gets likelihood 0 because 3 is outside. At , both points are inside and the product is .
Ordered iid . Density for , zero outside. . Give likelihoods.
Show answer and explanation
Products: .
04Use the same observed values and measurement units when comparing candidates#
Use the same observed values and measurement units when comparing candidates. Changing units rescales densities and their products; it does not turn likelihood into a posterior distribution over parameter settings. Only relative comparisons within the same setup are intended here.
Multiply all supplied densities after checking support. Density likelihood is a score for fixed observations, not their exact-point probability.
- Compare candidate parameters using a fixed continuous sample density.
Further questions
Why take logs of a likelihood?
Sources & further reading
- [1]Pishro-Nik, §8.2.3 Maximum Likelihood Estimation ↗Textbook · Book