Reading density curves
A probability density assigns interval probabilities through the areas beneath its curve.
On this page 9 sections
01Understand the idea#
For a continuous quantity, such as a measured delay, individual exact values have zero probability under a density model. Probabilities belong to intervals. The density’s height tells you how concentrated probability is per unit of the horizontal variable; area converts that concentration into probability.
The shaded interval runs from to . Its supplied area is , so it contains half the probability.
![Uniform density on [0,2], zero outside. Constant height 0.5. The interval [0.5,1.5] is shaded. Its supplied area is 0.5. Total area is 1.](/visuals/p-density-meaning/distribution-1v6tso7.svg)
![Uniform density on [0,2], zero outside. Constant height 0.5. The interval [0.5,1.5] is shaded. Its supplied area is 0.5. Total area is 1.](/visuals/p-density-meaning/distribution-1v6tso7-dark.svg)
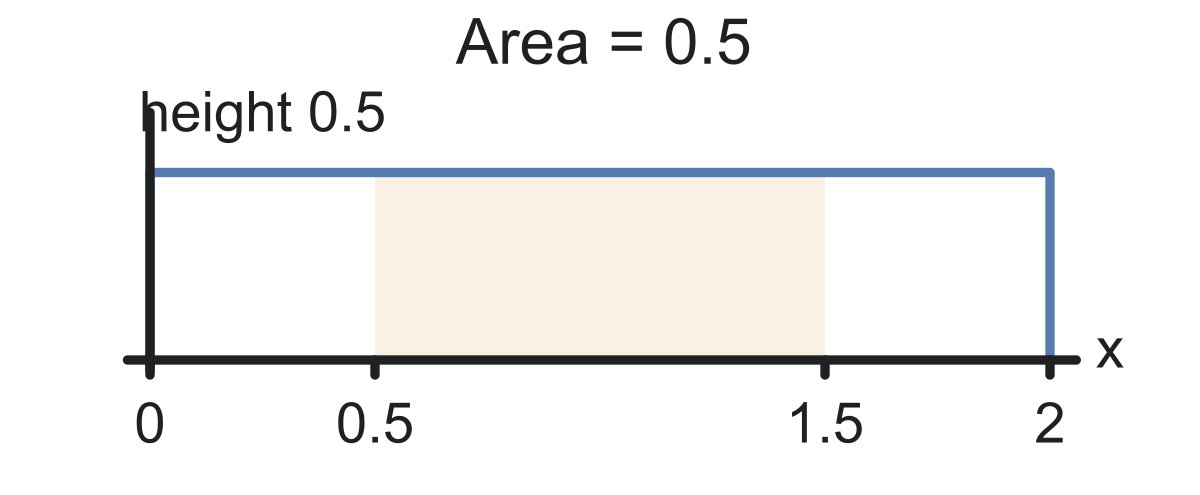
A density spreads probability over a line. An interval gets the area beneath the curve; the whole curve has area .
A uniform density on has height 0.5 because its total area must be 1. The interval has width 1, so its area is . An interval of width 0.2 has probability 0.1 under the same density. Reading the height alone ignores interval width.
Give .
Show answer and explanation
The shaded area is .
02Height measures concentration per unit of #
Height measures concentration per unit of . It can exceed . A narrow density with height can still have total area .
At a single exact point, the width is zero and the probability is . Including an endpoint does not change an interval probability.
A learner uses height for . Repair it.
Show answer and explanation
Use the area, .
03Work through the relationship#
For a continuous density, the probability outside an interval is what remains after its area is removed from .
is a delay. Give the chance outside .
Show answer and explanation
.
04A sensor model may assign a probability to falling within a tolerance band#
A sensor model may assign a probability to falling within a tolerance band. That is an area, not the density at the target reading. Changing measurement units changes density heights while leaving probabilities of corresponding intervals unchanged.
Use the supplied area for an interval probability. Heights are concentrations per unit, and total area is one.
- Interpret a supplied area under a continuous density curve as an interval probability.
Further questions
How do a normal density’s center and spread describe its shape?
Sources & further reading
- [1]Pishro-Nik, 4.1.1 Probability Density Function ↗Textbook · Book