Skip to content
Glacius
FoundationsConcept reference

Reading graphs

The graph of a scalar function consists of points whose horizontal coordinate is the input and whose vertical coordinate is the output.

On this page 7 sections
  1. Overview
  2. Each point on a function graph pairs an input x with an output f(x)
  3. A graph can be a set of separate dots
  4. Check your understanding
  5. Key takeaway
  6. Sources & further reading
  7. Concept connections

01Each point on a function graph pairs an input x with an output f(x)#

Each point on a function graph pairs an input xx with an output f(x)f(x). To find f(1)f(1), start at 1 on the horizontal axis and look directly above or below it for the graph.
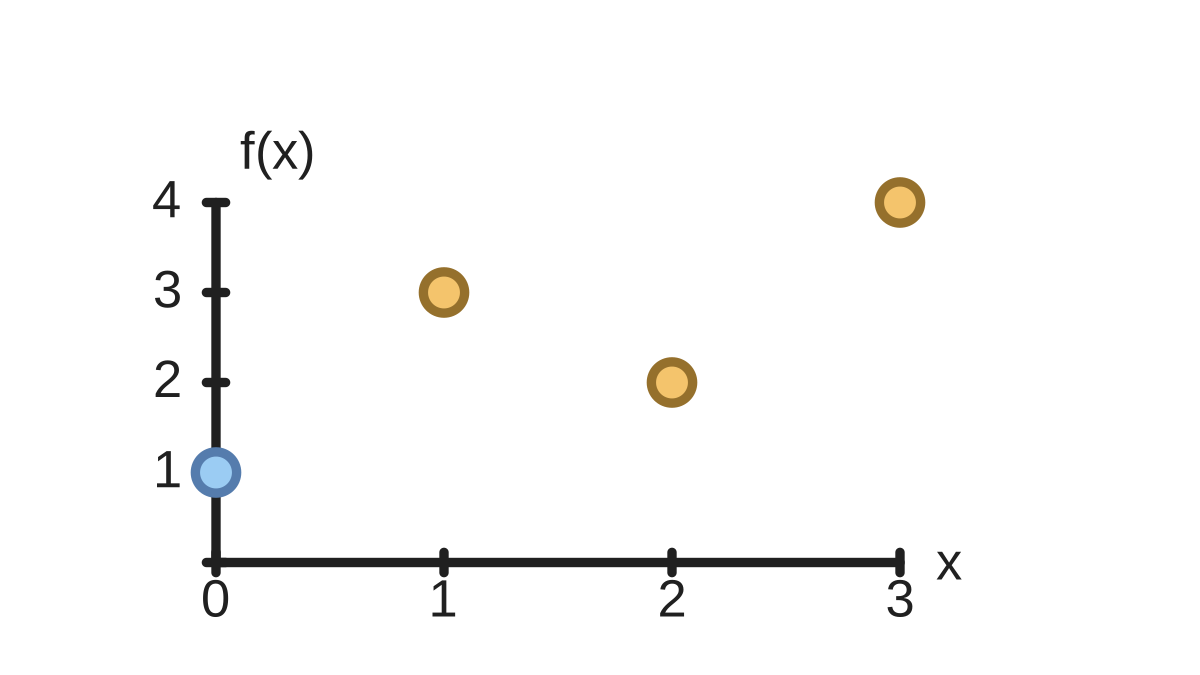
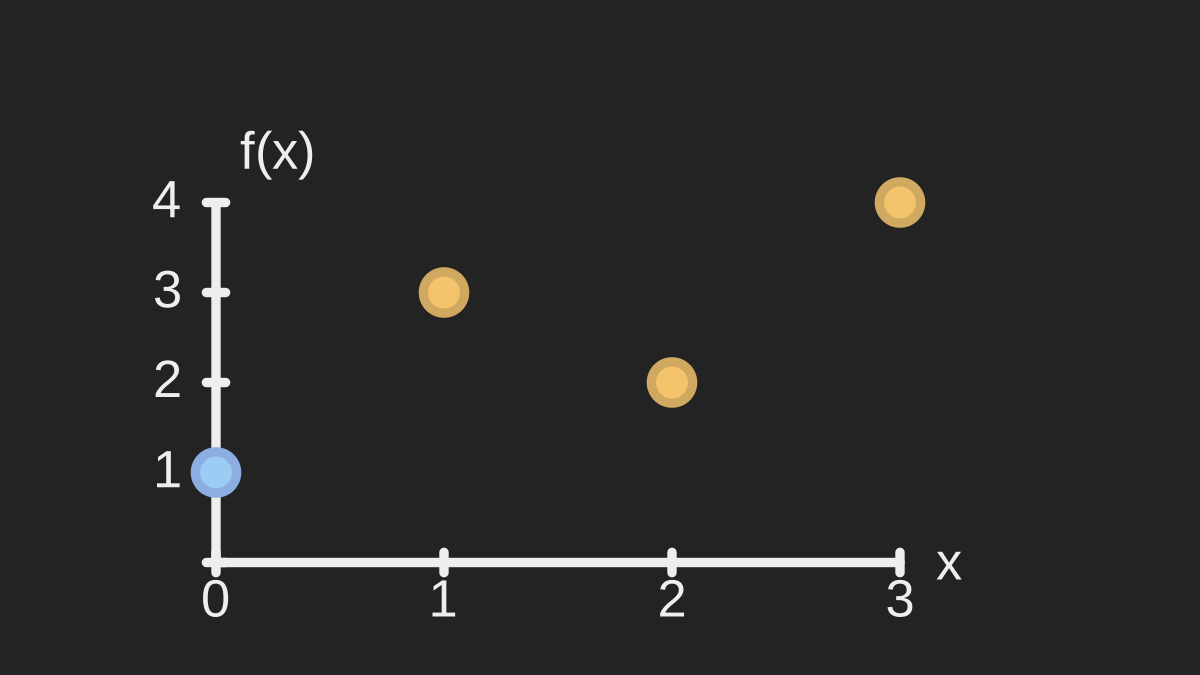
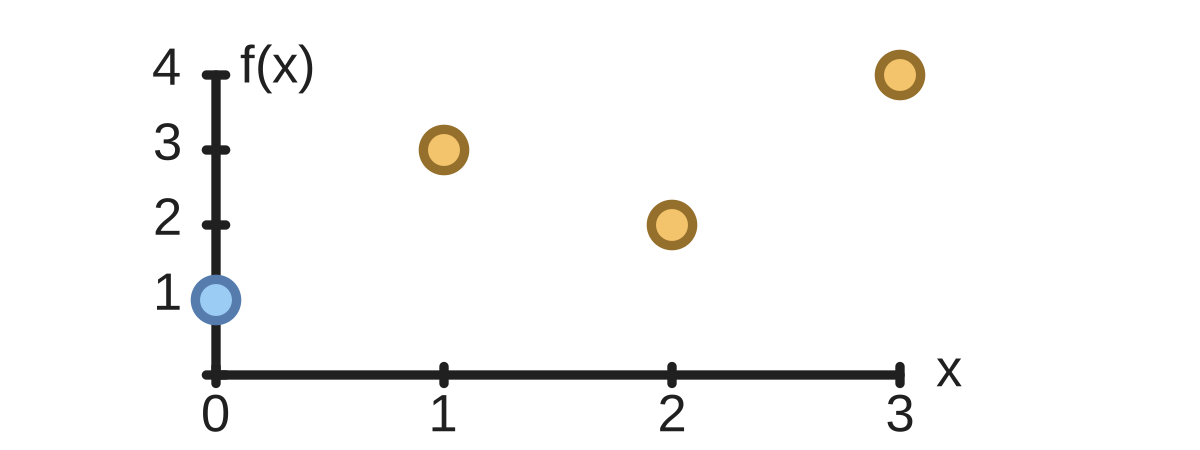
Four dots give the pairs (0,1), (1,3), (2,2), (3,4). The horizontal axis is input x and the vertical axis is output f(x).Four dots give the pairs (0,1), (1,3), (2,2), (3,4). The horizontal axis is input x and the vertical axis is output f(x).
Figure 1Four dots give the pairs (0,1), (1,3), (2,2), (3,4). The horizontal axis is input x and the vertical axis is output f(x).
Link to this figure ↗Download SVGDownload PNG

In this graph, the dot above input 1 sits at height 3. That means f(1)=3f(1)=3. We read the dot’s vertical coordinate, not how far it sits from a neighboring dot.
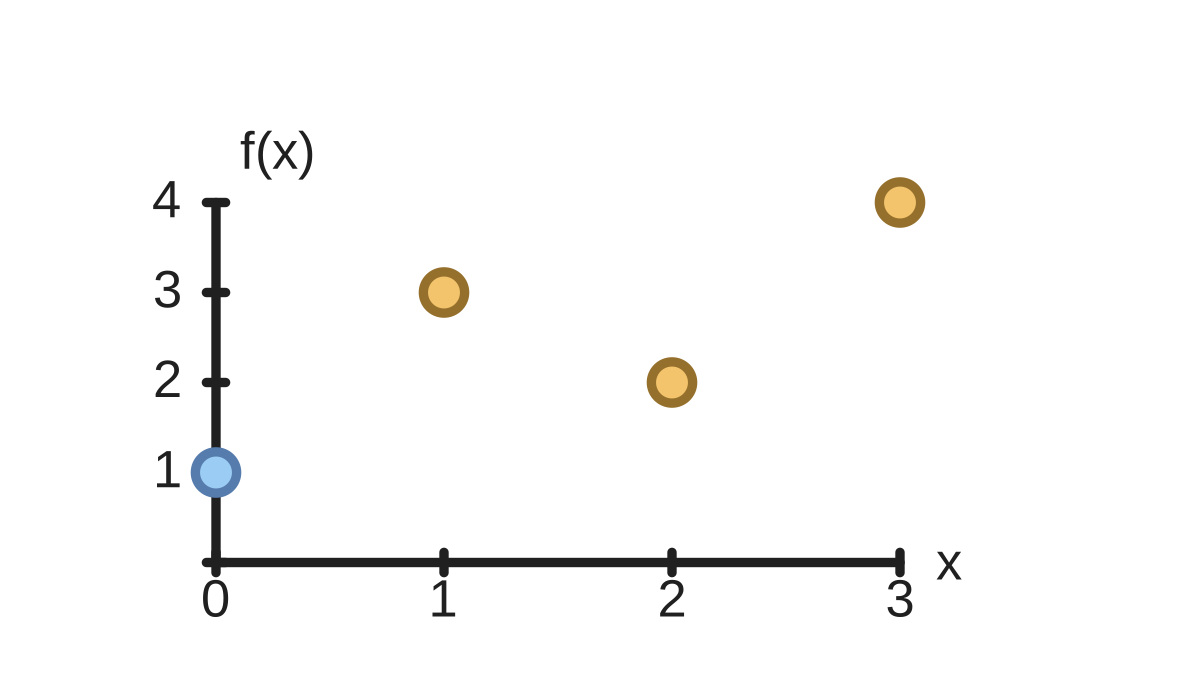
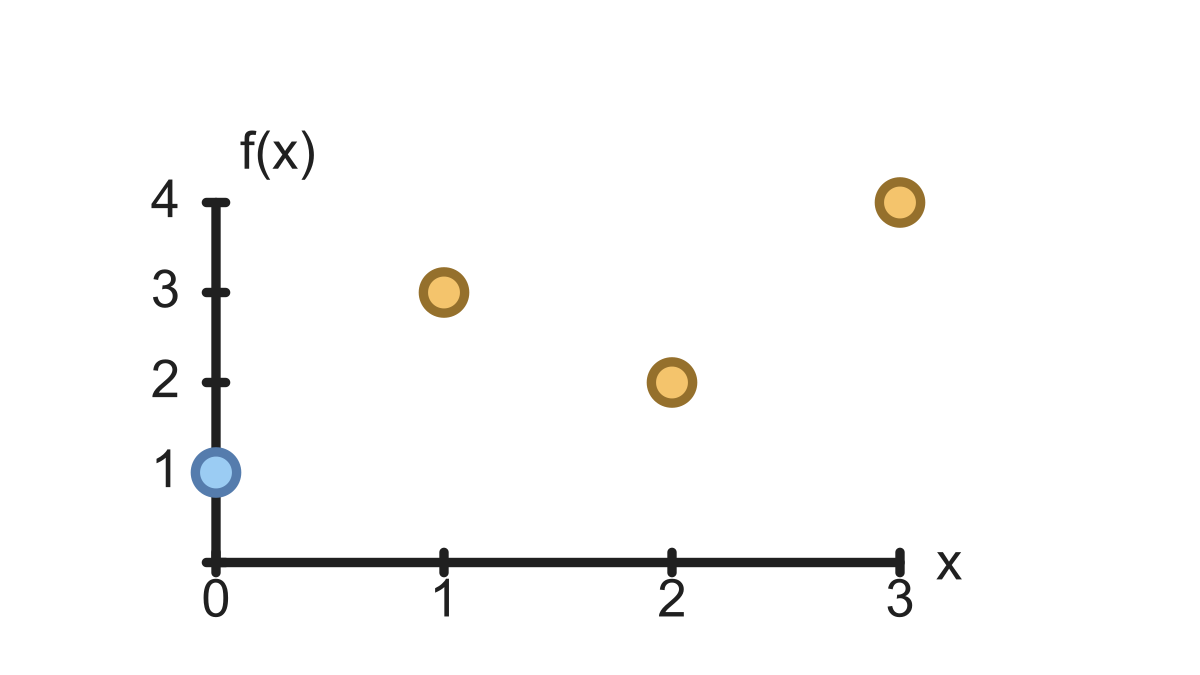
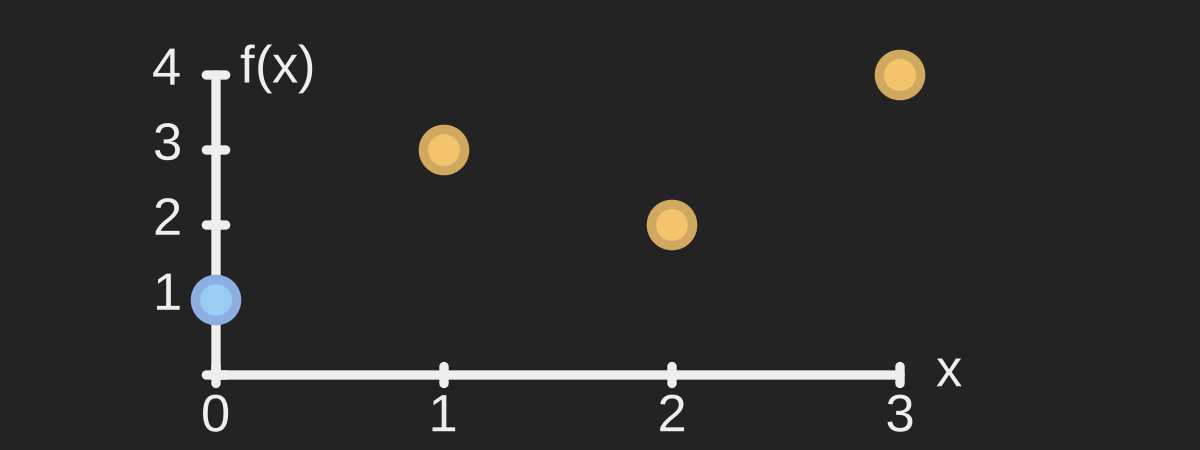
Four dots give the pairs (0,1), (1,3), (2,2), (3,4). The horizontal axis is input x and the vertical axis is output f(x).Four dots give the pairs (0,1), (1,3), (2,2), (3,4). The horizontal axis is input x and the vertical axis is output f(x).
Figure 2Four dots give the pairs (0,1), (1,3), (2,2), (3,4). The horizontal axis is input x and the vertical axis is output f(x).
Link to this figure ↗Download SVGDownload PNG
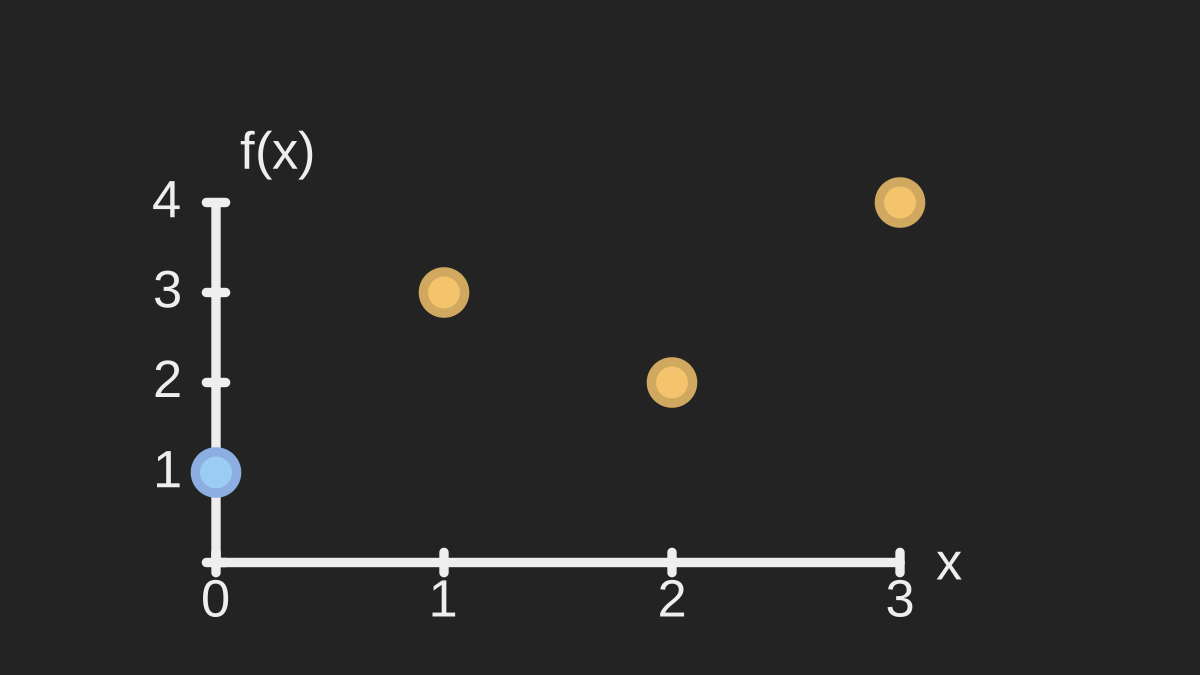
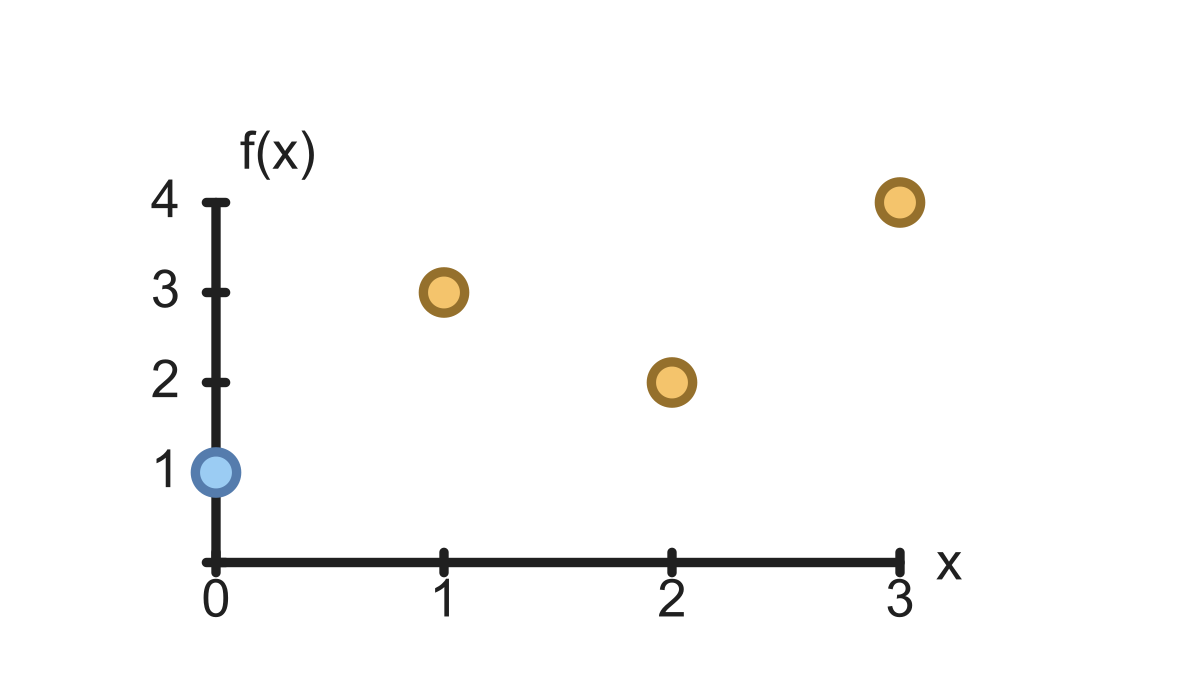
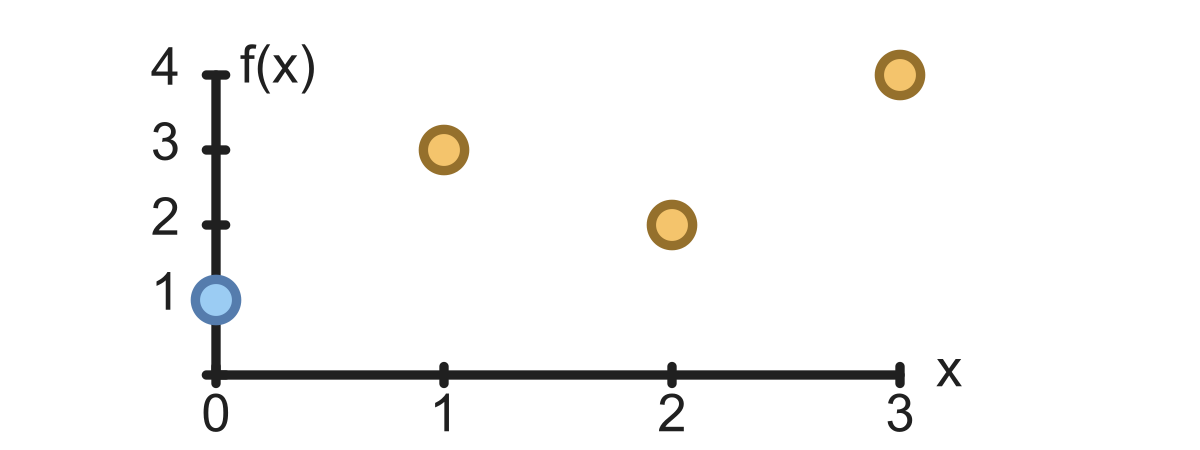
Four dots give the pairs (0,1), (1,3), (2,2), (3,4). The horizontal axis is input x and the vertical axis is output f(x).Four dots give the pairs (0,1), (1,3), (2,2), (3,4). The horizontal axis is input x and the vertical axis is output f(x).
Figure 3Four dots give the pairs (0,1), (1,3), (2,2), (3,4). The horizontal axis is input x and the vertical axis is output f(x).
Link to this figure ↗Download SVGDownload PNG
Check your reasoning

Read f(3)f(3) from the graph.

Show answer and explanation
4

Input 3 gives output 4.

02A graph can be a set of separate dots#

A graph can be a set of separate dots. If dots are not connected and no rule is given between them, do not invent outputs between the plotted inputs.

Check your reasoning

Only inputs 0, 1, 2, 3 are defined. Is f(1.5)f(1.5) specified?

  1. AYes, by averaging
  2. BNo
  3. CYes, it equals 1.5
Show answer and explanation
No

Input 1.5 is outside the stated domain.

03Check your understanding#

Check your reasoning

On a sensor plot, sample index is horizontal and reading is vertical. The point at sample 5 has vertical coordinate −2. What reading was recorded?

Show answer and explanation
-2

The reading is the vertical coordinate of that point: −2.

Key takeaway

Find the input on the horizontal axis, then read the graph’s output on the vertical axis.

  • Read the output of a scalar function from its graph

Sources & further reading

  1. [1]

Reference this concept

Link to this page, a section, or an individual figure.

Glacius. “Reading graphs.” Math behind ML. /learn/f-graph