Skip to content
Glacius
CalculusConcept reference

Approaching a limit

A finite limit is the single real value approached by function outputs at all sufficiently nearby inputs other than the target input.

On this page 8 sections
  1. Overview
  2. In this graph, inputs near 2 give outputs near 4
  3. A finite table only suggests a trend
  4. Changing only f(a) leaves nearby values unchanged
  5. Key takeaway
  6. Further questions
  7. Sources & further reading
  8. Concept connections

01In this graph, inputs near 2 give outputs near 4#

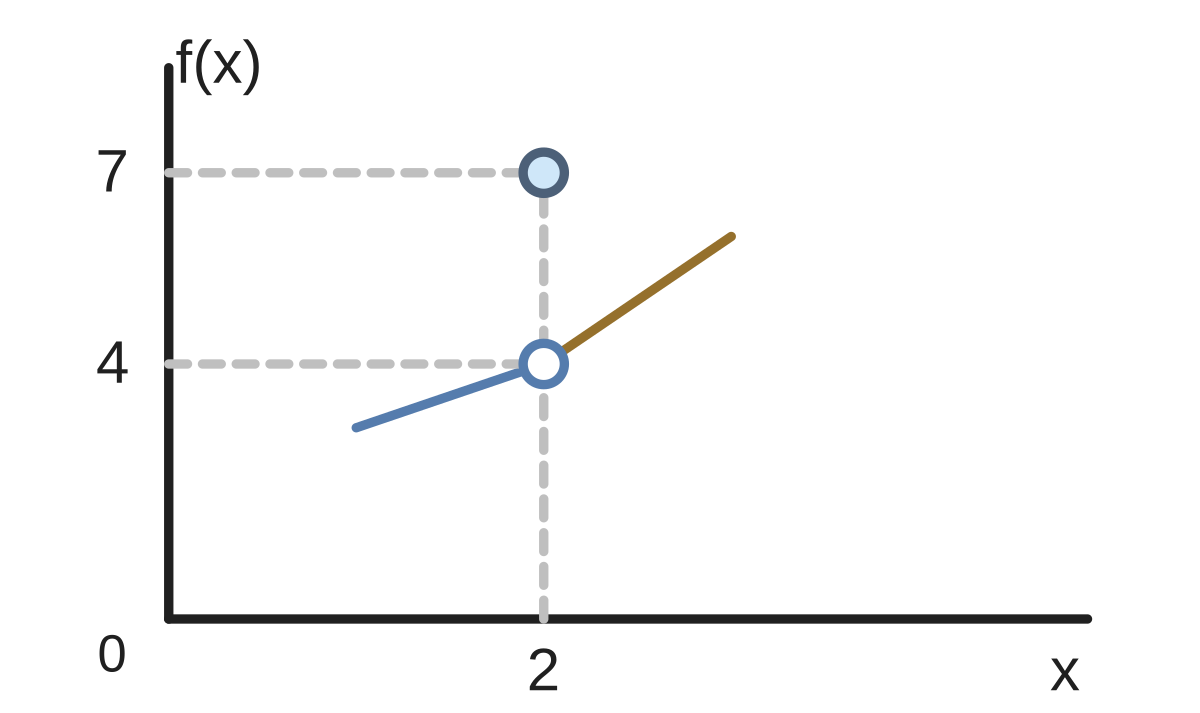
In this graph, inputs near 2 give outputs near 4. Both straight branches lead toward the open point at height 4. The filled point sets f(2)=7f(2)=7.

Graph near x=2: the left straight branch joins (1,3) to the open point (2,4); the right straight branch joins that open point to (3,6). A separate filled point is at (2,7). The branches describe all nearby inputs other than 2. Axes use 50 pixels per x unit and 17 pixels per output unit.Graph near x=2: the left straight branch joins (1,3) to the open point (2,4); the right straight branch joins that open point to (3,6). A separate filled point is at (2,7). The branches describe all nearby inputs other than 2. Axes use 50 pixels per x unit and 17 pixels per output unit.
Figure 1Graph near x=2: the left straight branch joins (1,3) to the open point (2,4); the right straight branch joins that open point to (3,6). A separate filled point is at (2,7). The branches describe all nearby inputs other than 2. Axes use 50 pixels per x unit and 17 pixels per output unit.
Link to this figure ↗Download SVGDownload PNG

To read a limit at aa, move toward aa from both sides without using aa itself. The outputs must approach one common finite value and stay close as the inputs get closer.

limxaf(x)=L\lim_{x\to a}f(x)=L
Check your reasoning

Limit at x=2x=2? Each side is straight through its samples. f(2)=8f(2)=8. x1.91.99f(x)2.92.99x2.012.1f(x)3.023.2\begin{array}{c|rr}x&1.9&1.99\\f(x)&2.9&2.99\\x&2.01&2.1\\f(x)&3.02&3.2\end{array}

Show answer and explanation
3

Both branches approach 3.

02A finite table only suggests a trend#

A finite table only suggests a trend. Extra behavior could hide between samples. The practice tables therefore specify that each local branch is a straight line all the way toward the target.

Check your reasoning

Limit at x=1x=1? Each side is straight through its samples. f(1)f(1) is undefined. x0.90.99f(x)1.81.98x1.011.1f(x)2.012.1\begin{array}{c|rr}x&0.9&0.99\\f(x)&1.8&1.98\\x&1.01&1.1\\f(x)&2.01&2.1\end{array}

Show answer and explanation
2

Both approach 2.

03Changing only f(a) leaves nearby values unchanged#

Changing only f(a)f(a) leaves nearby values unchanged. A limit may equal f(a)f(a), differ from it, or exist when f(a)f(a) is undefined. It is the continuing nearby behavior that matters.

Check your reasoning

Sensor reading f(x): Limit at x=0x=0? Each side is straight through its samples. f(0)=4f(0)=4. x0.10.01f(x)3.93.99x0.010.1f(x)4.024.2\begin{array}{c|rr}x&-0.1&-0.01\\f(x)&3.9&3.99\\x&0.01&0.1\\f(x)&4.02&4.2\end{array}

Show answer and explanation
4

Both approach 4.

Key takeaway

A limit describes nearby outputs, not an isolated point.

  • Infer a finite limit from nearby values while distinguishing the endpoint value

Further questions

Does a table prove a limit?
No. A finite table samples only finitely many inputs. You need a justified rule or behavior for all sufficiently nearby inputs. The tables in this lesson explicitly specify their straight local branches.

Sources & further reading

  1. [1]

Reference this concept

Link to this page, a section, or an individual figure.

Glacius. “Approaching a limit.” Math behind ML. /learn/c-limit