Collinearity
Collinearity is dependence or near dependence among predictor columns that prevents stable separation of their coefficients.
On this page 9 sections
- Overview
- Collinearity means that other feature columns explain one column exactly or approximately
- Exact dependence permits different coefficient vectors with identical fitted predictions
- For rows and , coefficients and both predict
- A closer look
- Key takeaway
- Further questions
- Sources & further reading
- Concept connections
01Collinearity means that other feature columns explain one column exactly or approximately#
Collinearity means that other feature columns explain one column exactly or approximately. Recording a length in both meters and centimeters adds two columns but only one independent measurement. Regression may struggle to assign separate effects to their coefficients.
If one feature is and another is , coefficients and produce the same prediction. The data cannot identify which allocation is correct. With nearly repeated columns, small data changes can lead to large coefficient changes even while fitted outputs remain close.
Identical predictor columns cannot distinguish separate coefficients. For rows and , coefficient changes cancel in both predictions.
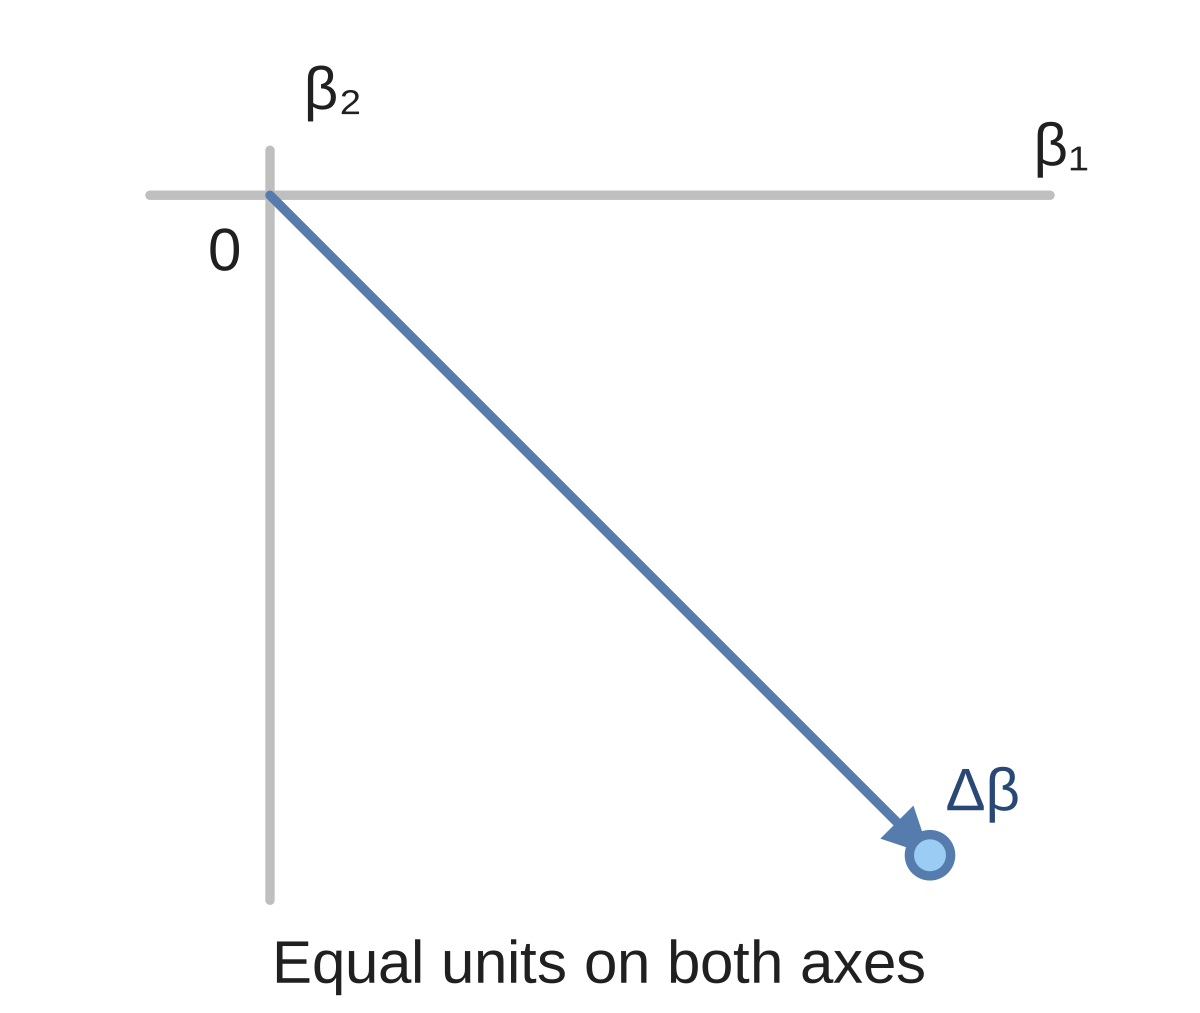
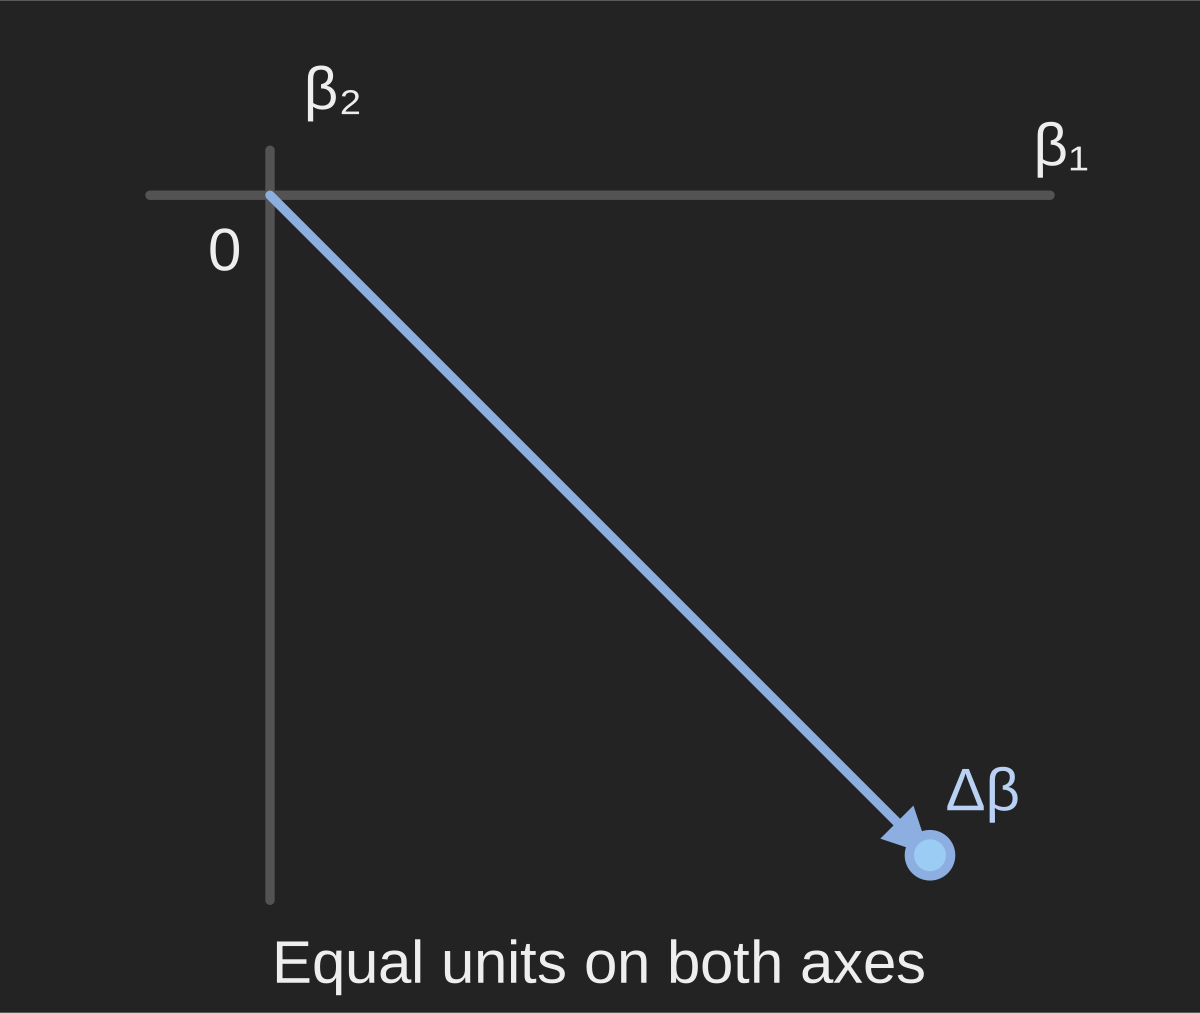
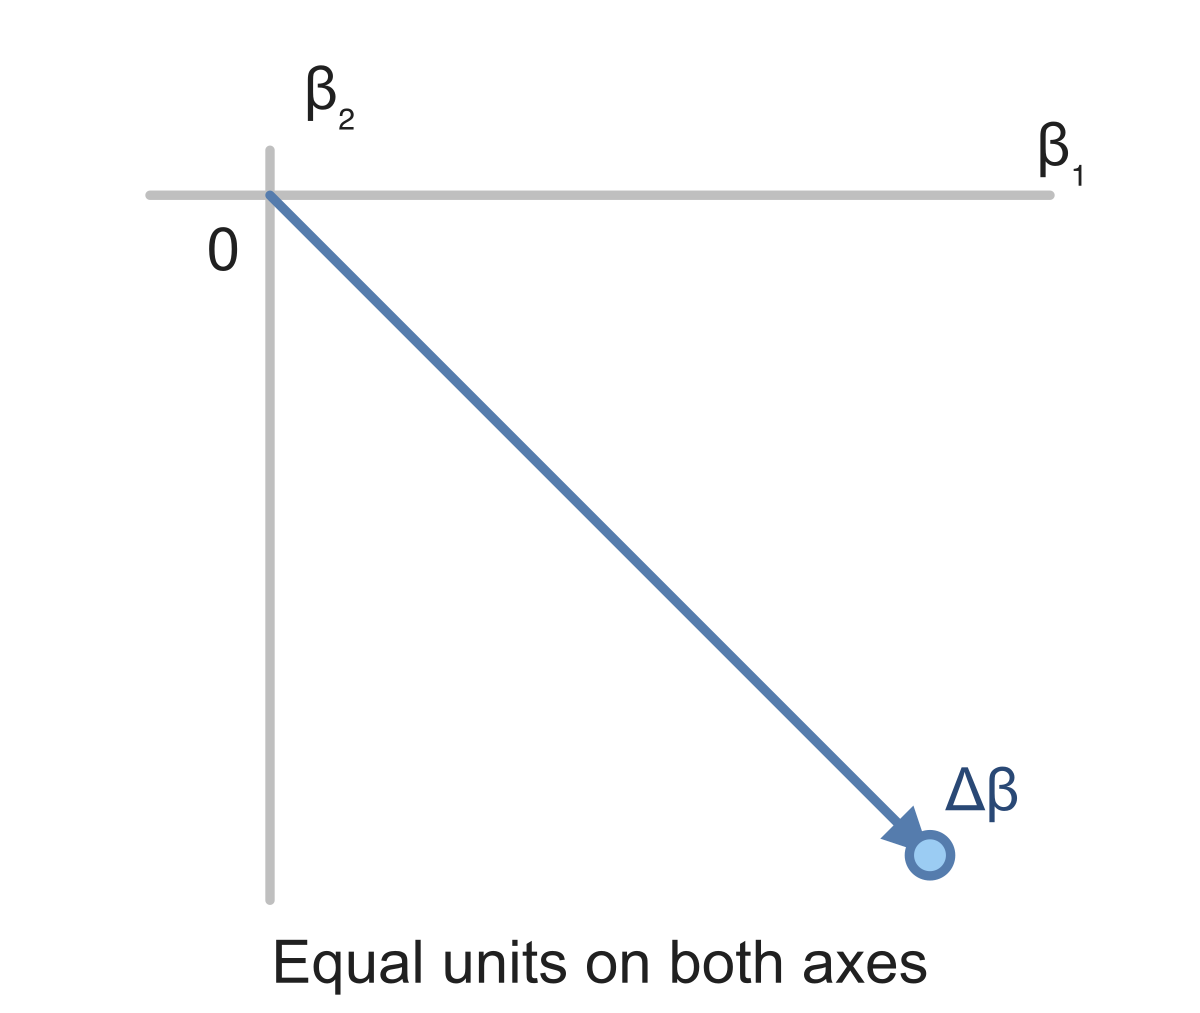
The prediction change is . For rows and with , the changes are 0 and . Large opposing coefficients nearly cancel.
Use the complete singular-value list for the design matrix. A zero scale means an exact lost direction and deficient rank. A very small positive scale means that direction survives but is weak. For scales , the ratio is 1000; calling the columns fully independent does not make the system well conditioned.
Design rows ; . Coefficient shift . Prediction shift?
Show answer and explanation
Dot products: .
02Exact dependence permits different coefficient vectors with identical fitted predictions#
Exact dependence permits different coefficient vectors with identical fitted predictions. Near dependence can instead give a unique but sensitive fit: small response changes may require large coefficient changes. Check the design, not the coefficient sizes alone.
Design rows ; . Coefficient shift . Claim: prediction shift . Repair.
Show answer and explanation
Dot products: .
03For rows and , coefficients and both predict #
For rows and , coefficients and both predict . That agreement holds on these rows. A new row gives 1 versus 101; do not extend the cancellation to arbitrary new data.
Design rows ; . Two fits: and . Give the largest absolute prediction difference.
Show answer and explanation
Prediction change ; largest absolute entry .
04A closer look#
Before interpreting a fitted coefficient, inspect whether another feature carries almost the same information. Removing redundancy or using a stated regularization method can change the fit. Collinearity by itself is not evidence that two measurements have a causal relationship.
Multiply coefficient shifts by the design. Dependent or nearly dependent columns can make their prediction effect small.
- Diagnose coefficient instability caused by dependent or nearly dependent predictors.
Further questions
Does stable prediction make each coefficient trustworthy?
Sources & further reading
- [1]
- [2]