Mean intervals
A one-sample t interval adds and subtracts a t critical value times the estimated standard error from the sample mean under stated sampling conditions.
On this page 8 sections
01A sample mean gives one estimate of a population mean#
A sample mean gives one estimate of a population mean. A one-sample t interval adds a margin reflecting uncertainty from having only a sample and estimating the population spread. Under the IID normal model, the t critical value uses degrees of freedom.
For an IID normal sample with unknown population standard deviation, a one-sample t interval estimates the population mean. Use at least two observations and the sample SD based on denominator .
Center at sample mean . Multiply estimated standard error by the supplied critical value . Its degrees of freedom are .
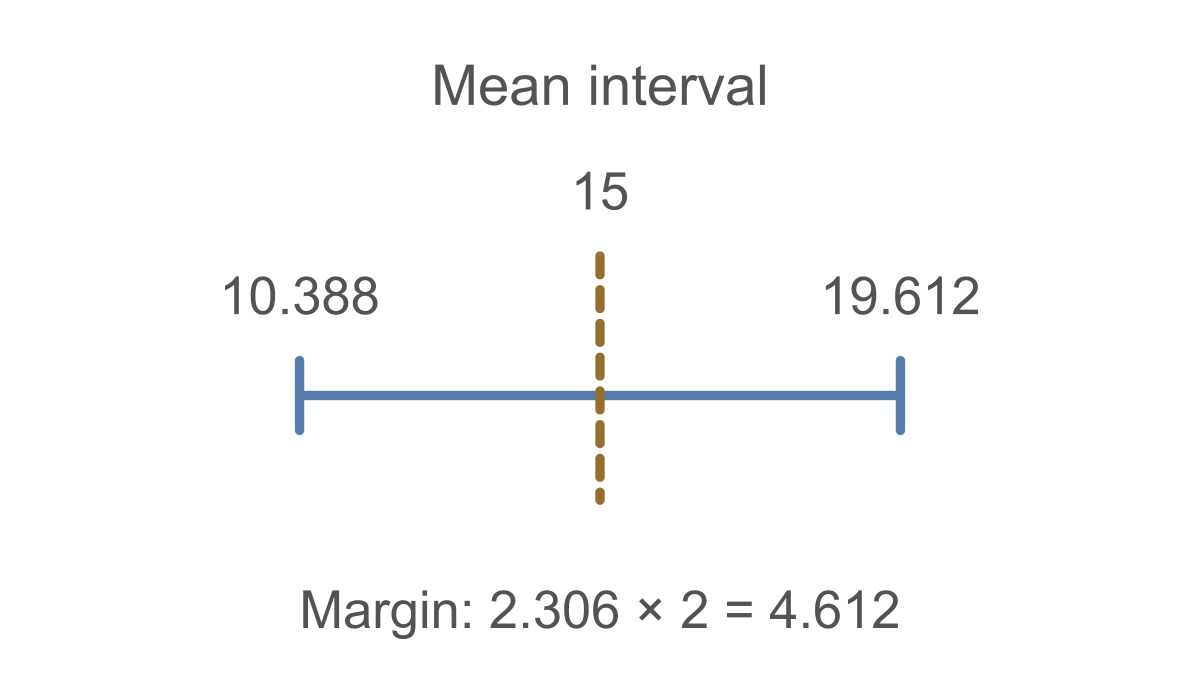
For sample size 9, sample mean 15, and sample SD 6, first calculate . With supplied critical value 2.306, the margin is . Subtract and add that margin to the mean to obtain . The margin is not the standard deviation of individual observations.
For , mean and sample SD , SE is . A supplied 95% critical value gives margin .
![Under the stated IID normal model, sample size 9, sample mean 15 and sample SD 6 give SE 6/sqrt(9)=2. With supplied 95% critical t=2.306, margin 2.306 times 2=4.612. The interval [10.388,19.612] is centered on 15; equal horizontal distances represent equal numeric distances.](/visuals/s-mean-interval/number-line-nxegs7.svg)
![Under the stated IID normal model, sample size 9, sample mean 15 and sample SD 6 give SE 6/sqrt(9)=2. With supplied 95% critical t=2.306, margin 2.306 times 2=4.612. The interval [10.388,19.612] is centered on 15; equal horizontal distances represent equal numeric distances.](/visuals/s-mean-interval/number-line-nxegs7-dark.svg)
IID normal sample: n=4, mean=6, sample SD=2. For 95%, use t*=3.182. Rounded interval?
Show answer and explanation
SE=1; margin=3.182.
02For data , the mean is #
For data , the mean is . Squared deviations add to . Dividing by gives variance , so sample SD is .
For , mean and sample SD give SE . Using the supplied 95% critical value , the interval is . Critical values here are rounded. Round interval endpoints to three decimals.
IID normal sample: 3, 3, 3, 7. Sample variance divides by n-1. For 95%, use t*=3.182. Rounded interval?
Show answer and explanation
SE=1; margin=3.182.
03The arithmetic alone does not validate the procedure#
The arithmetic alone does not validate the procedure. Normality and independent sampling are separate conditions. A small estimated standard error cannot repair dependent sampling. Coverage refers to repeated intervals under the stated model.
IID normal sample: n=16, mean=3, sample SD=8. For 95%, use t*=2.131. “SE=8.” Repair rounded interval.
Show answer and explanation
SE=2; margin=4.262.
04The interval estimates the population mean#
The interval estimates the population mean. It need not contain 95% of individual data values. The stated coverage depends on the sampling and distribution assumptions; correct arithmetic cannot compensate for systematically biased or dependent sampling.
For the stated IID normal model, compute s/sqrt(n), multiply by the supplied t critical value, then subtract and add the margin around the sample mean.
- Construct both t-interval endpoints.
Sources & further reading
- [1]
- [2]Pishro-Nik, Introduction to Probability, 8.3.1 General Framework of Interval Estimation ↗Pishro-Nik, Introduction to Probability · Book