Test statistics
A supplied test statistic turns observations and a null reference into a numerical discrepancy.
On this page 8 sections
01Understand the idea#
A test statistic measures how far the sample result departs from a null model in a standardized way. Its definition determines what counts as more extreme evidence. Calculating the statistic is distinct from finding the tail probability associated with it.
A test statistic is a rule that summarizes discrepancy from a null claim. Use the supplied formula. A standardized discrepancy divides an estimate-minus-null difference by a positive standard error.
For estimate 17, null 11 and SE 3, subtract first: 17−11=6. Then divide: T=6/3=2. This is two standard-error units above the null.
With sample estimate 12, null value 10, and standard error 1, a signed statistic equals 2. If the estimate were 8, it would be . A two-sided test may regard both as equally extreme, while a right-sided test treats their directions differently.
Rule: T=(estimate-null)/SE. Estimate=5, null=11, SE=2. T?
Show answer and explanation
Difference -6; T=-3.
02Let d mean estimate minus null#
Let d mean estimate minus null. Compare each difference using its own SE. X gives 6/3=2; Y gives 4/1=4. Y has the larger standardized discrepancy.
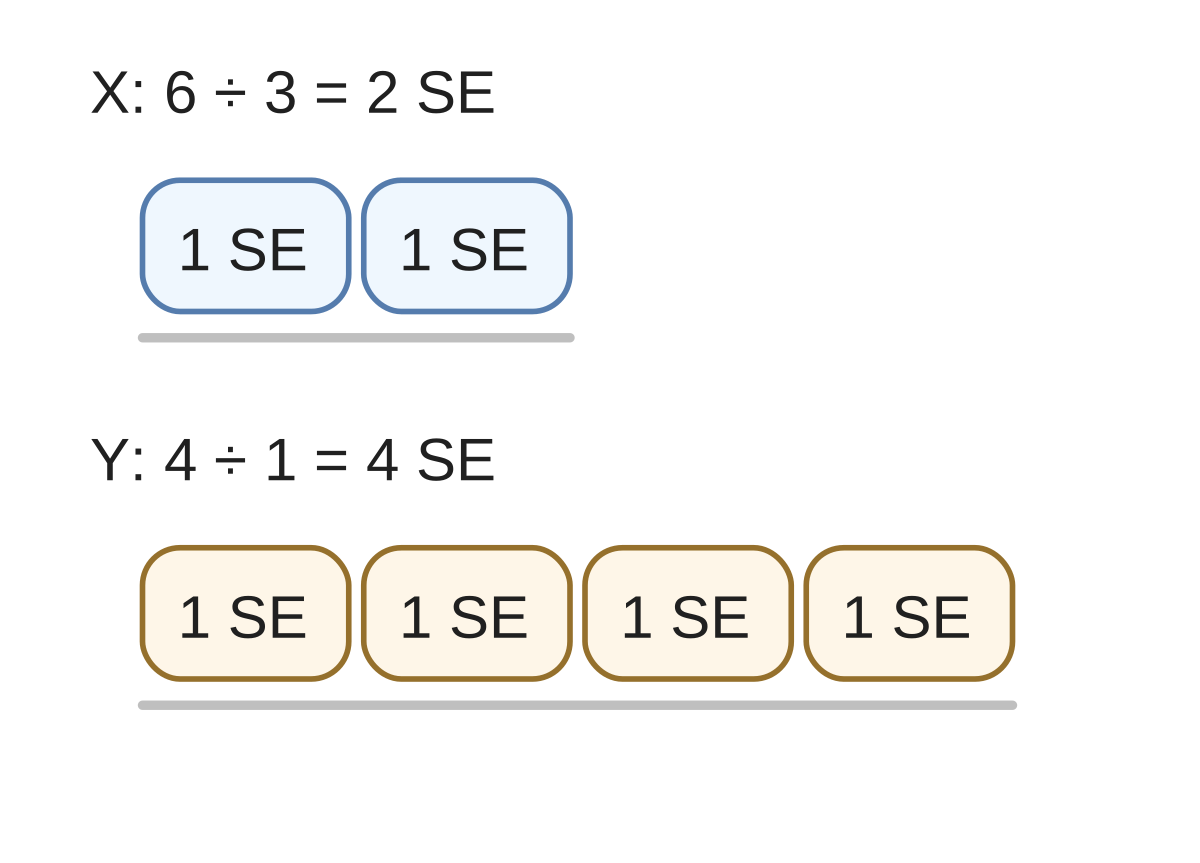
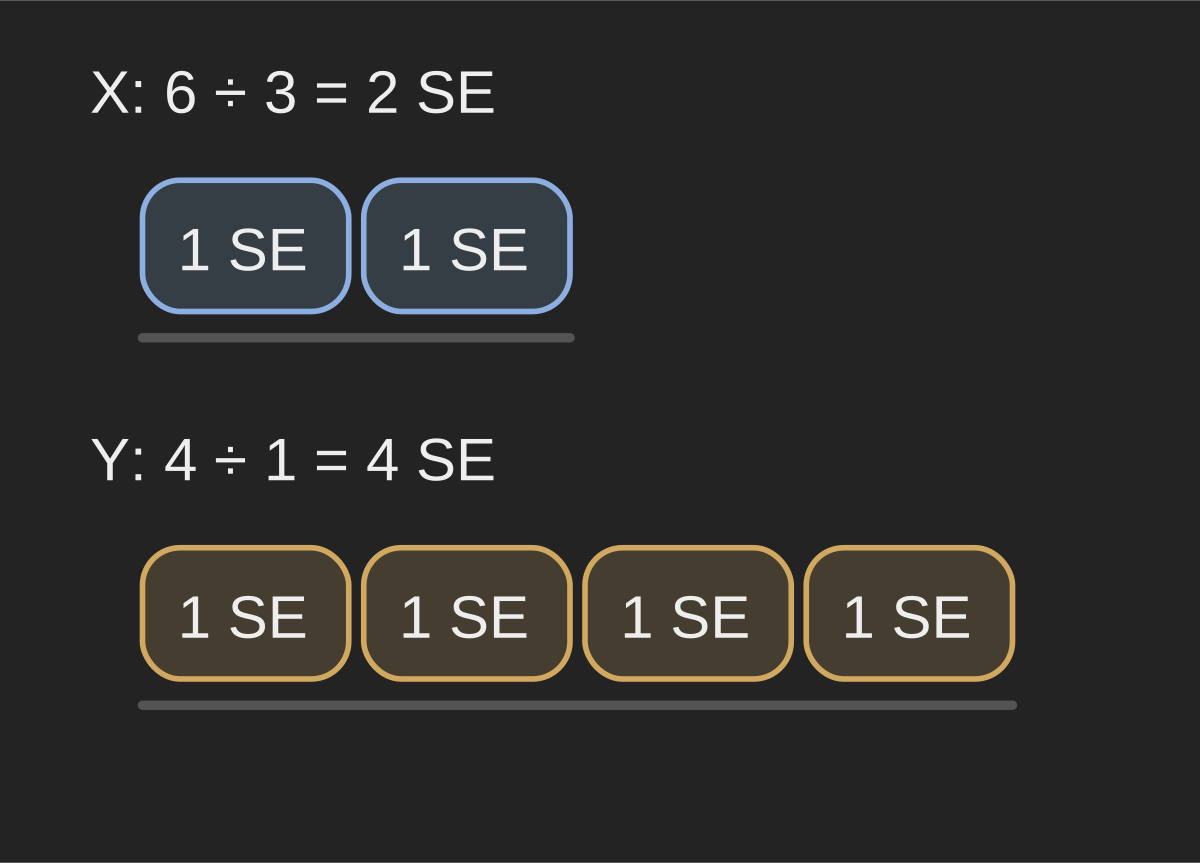
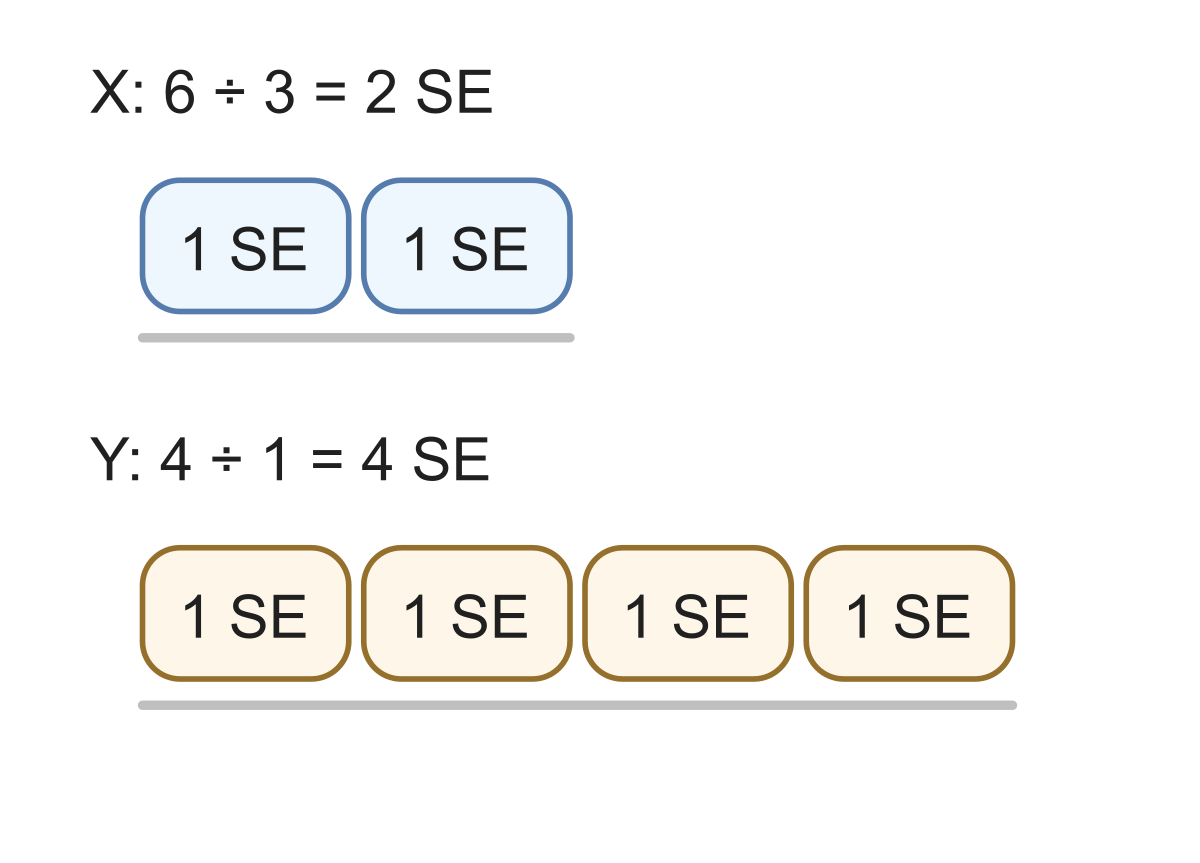
Rule T=d/SE; d=estimate-null. X: d=9, SE=3. Y: d=4, SE=1. (TX,TY); larger |T|?
Show answer and explanation
TX=3, TY=4; compare magnitudes.
03A signed rule preserves direction#
A signed rule preserves direction. Estimate 8, null 12 and SE 2 give T=−2. If the supplied rule uses an absolute difference instead, its result is 2. At estimate=null, either rule gives 0. These numbers alone do not supply a p-value.
Rule: T=(estimate-null)/SE. Estimate=7, null=1, SE=2. “T=6: omit SE.” Repair T.
Show answer and explanation
Difference 6; T=3.
04The statistic’s reference distribution depends on the null model and assumptions#
The statistic’s reference distribution depends on the null model and assumptions. A large raw difference may be unremarkable when its sampling uncertainty is large. Identify the target, null value, scale, and tail direction before interpreting an observed statistic.
Follow the supplied formula: subtract in order, divide by the stated positive scale, and take absolute value only when required.
- Compute the supplied test statistic.
Sources & further reading
- [1]Pishro-Nik, 8.4.2 General Setting and Definitions ↗Pishro-Nik, Introduction to Probability · Book